This Is Where I Draw The Line
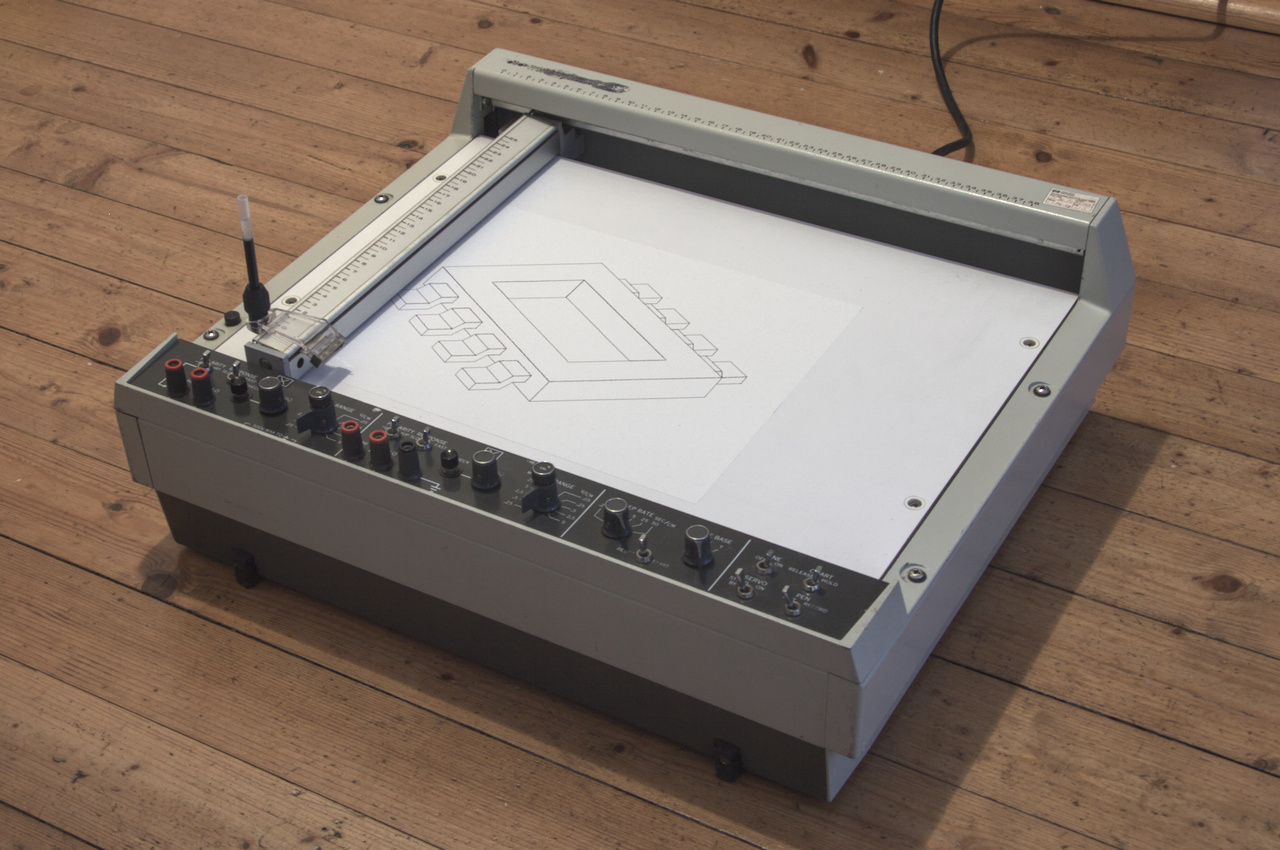
So I’ve had a pen plotter for quite a while now. It has shown up a few years back in a post on this site, where I used it for its intended purpose—recording X–Y curves. This plotter is quite a beast, it’s big (up to DIN A3) and heavy, and it’s unlike the majority of vintage plotters you’ll see people using online. This HP 7045A is fully analogue, which means it takes an X voltage and a Y voltage and directly controls the axis motors with analogue servo loops. In fact, it’s more correctly referred to as a recorder, rather than a plotter, since its purpose is to record measurement charts.
Now, hypothetically, should I want to use this plotter for some ‘plotter art’, i.e. something from stylised images drawn with pen strokes only to fully generative vector art, I could start with what I have. With an X and a Y input, I could draw some Lissajous curves or maybe build a Lorentz attractor.1
Though, this is a great opportunity to complicate matters the proven way: by connecting the thing to a computer.
The easy way to go about this would be to use a sound card. Two channels for X and Y, a third one to control the pen state. Since you can get them to work down to DC by removing the coupling capacitors, that’ll work just fine. You could plot something with just a sound file from any computer.
But that would be kind of boring.
Some sort of adaptor
I looked around for a while but curiously, I wasn’t able to find an interpreter for some vector graphics format with coordinate outputs as plain voltages—something I could rehash for this project. Luckily, there are a lot of shortcuts I could take while designing my own, which made this project very manageable in scope.
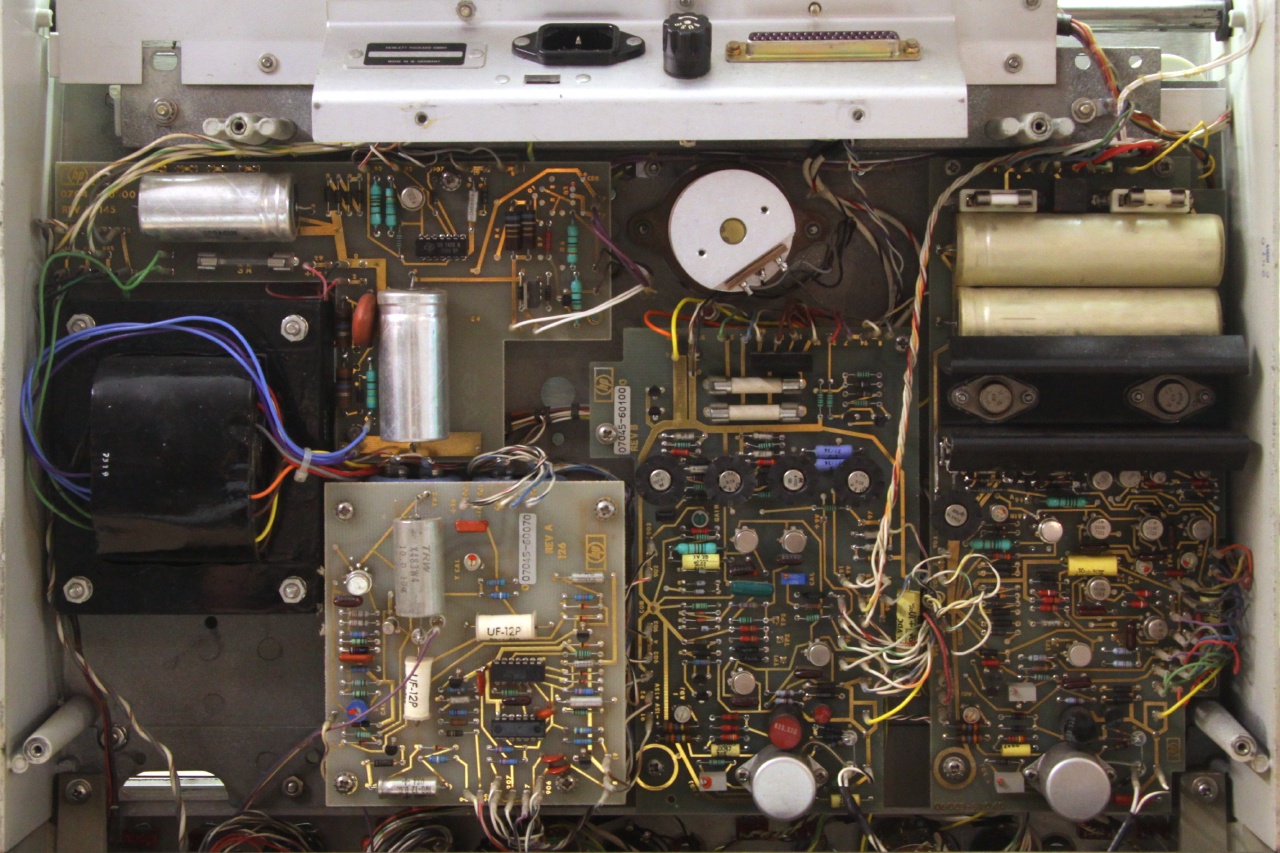
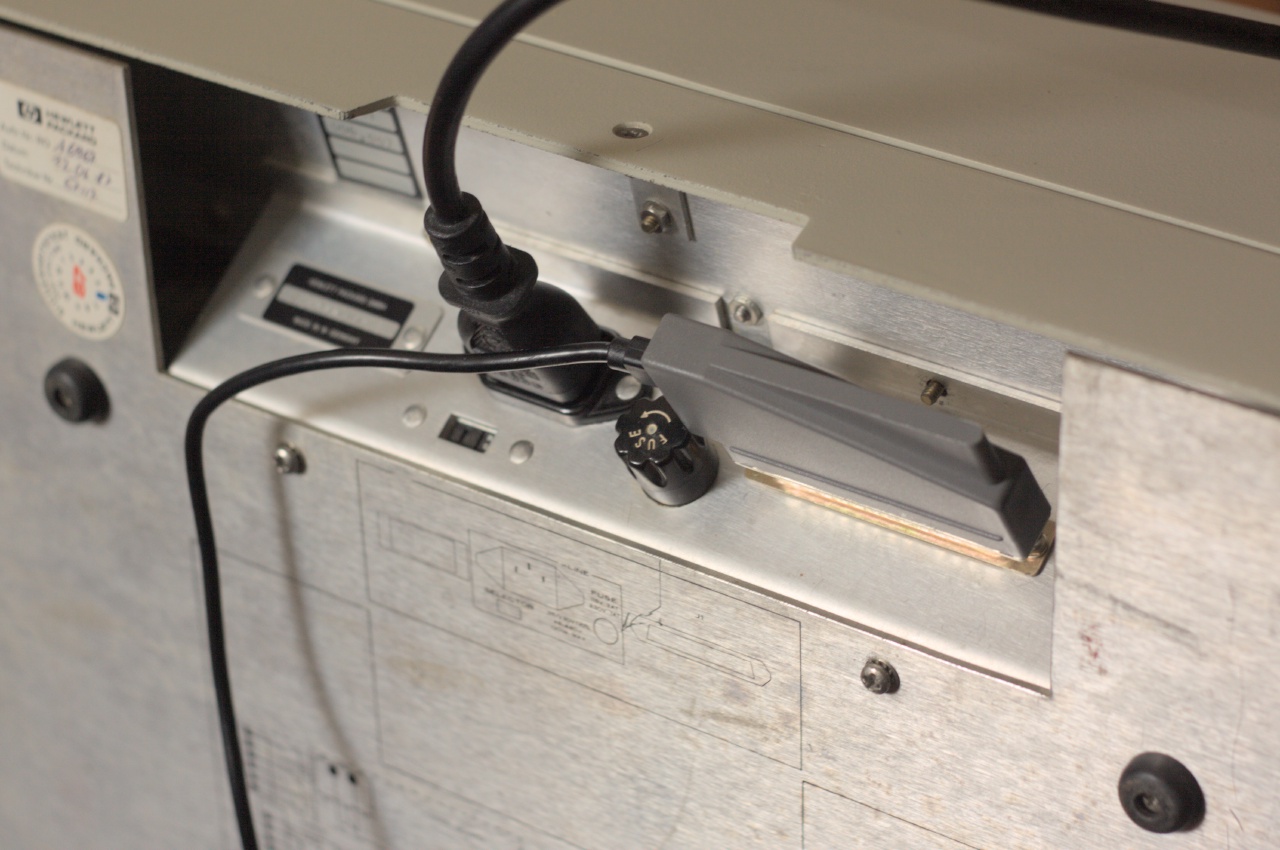
First, the expected output voltages don’t come with many requirements. After all, the HP 7045A is a piece of measurement equipment, providing two isolated input channels with high impedance and selectable voltage ranges. This makes it possible to wire the banana jacks in the front directly to the outputs of a DAC without any special driver. Even better, the HP 7045A has a large sub-D connector in the back (visible near the top in the picture above) which exposes all the signals necessary for controlling it, i.e. the two analogue inputs and a TTL pen state control signal. Using that, a circuit can be neatly tucked into the back, with no wiring to mess up.
On the adaptor’s input side, a natural format is HP-GL, the Hewlett-Packard Graphics Language. This, HP came up with to control their pen plotters with (the computer-connected variety, that is). Using HPGL means that I can benefit from existing tooling, such as built-in export functionality in Inkscape while having a simpler format to interpret on the adaptor’s side than, say, SVG.
The adaptor could present itself as a serial interface, so that I can both enter commands manually or just cat an HPGL file into it:2
$ # Draw a square
$ echo PU0,0;PD0,1000,1000,1000,1000,0,0,0;PU > /dev/ttyACM1
$ # Plot a file
$ cat 25120.hpgl > /dev/ttyACM1
Being introduced in 1977, this is an extremely simple language. It has a bunch of two-letter commands followed by plain ASCII digits for the coordinates—easy enough to build an interpreter for.
Though, being designed for early computers, it also contains some commands which make it convenient to use by hand, such as commands to write text, set a sub-area to plot in, or draw arcs. I decided to just ignore all of these and focus on the subset which Inkscape’s HPGL output actually produces; everything beyond that would mostly be wasted implementation effort since all of that is much better done by the computer driving the adaptor. Even scaling the coordinate values can be left out, since I can let the plotter draw a square, measure the actual size and use a calculated DPI value for both axes in the Inkscape HPGL export or my own HPGL-generating code.
A concrete circuit
To actually implement this idea, I grabbed an STM32F103. This controller is more than powerful enough to present itself as a communication-class device over USB (i.e. a virtual serial port), parse basic movement commands (and a few more), shove them into a ring buffer, and steadily interpolate between the coordinates to produce slowly varying voltages to guide the pen along a drawing.
USB is very convenient here for the flow control as well: if the ring buffer is full—which will happen quickly for larger drawings since sending data is much quicker than actually drawing—it can just stop accepting new data. It’ll end up in backlog on the host side and be sent as soon as there is space available. Basically, I get serial port handshaking for free, even without having to configure it.
For the DAC, resolution is most important, bandwidth is basically irrelevant. Thus, I went for a PWM output plus low-pass filter.

The filter uses a GS8334 precision op amp because I had them around and wanted to try them out, but since accuracy is actually determined by the microcontroller supply voltage and the plotter’s 1970s op amps, an LM324 would do the job just as well.
This circuit is easy enough to breadboard and get plotting with a blue/black pill board. The plotter’s voltage range is set such that the PWM range covers the whole page and the scale can be calibrated before HPGL export (since I didn’t implement any scaling in the adaptor firmware).
The pen ‘state’ control isn’t optimal, though. The clonk noise in the video makes it evident how the plotter slams the pen down and tears it up again. In its intended application, that is a non-issue: you’d set the pen down once, trace a curve, and lift it up—no need for grace or fine control. Hence, there’s but a simple solenoid in the HP 7045A.
I managed to soften the descent and ascent slightly by PWMing the pen state output as well. It is a bit better than in the video above, but I was only able to do so much without mechanical modifications of the printer (which I wasn’t going to do).
Unfortunately, intermittently working on this project, then switching to a timer channel for the pen state output meant my breadboard prototype and schematic got de-synchronised and the final PCB needed a bodge to swap some pins.3
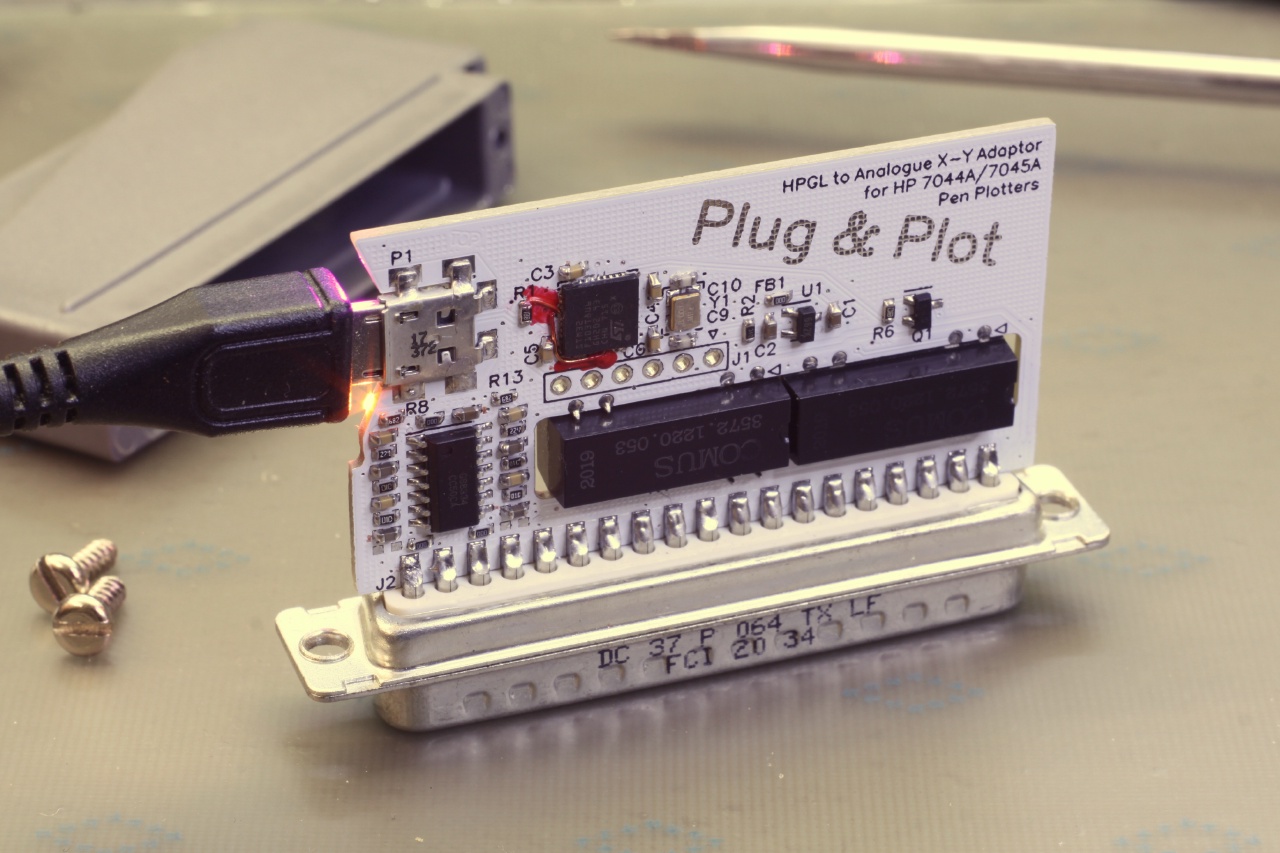
On that topic—I designed a little PCB with everything to actually make use of that tidy back connector on the plotter. A sub-D connector shell provides an effortless case. I went with a Molex 1731110011, which works perfectly for this purpose, even without modifications. If you omit the strain relief parts, the side opening is big enough to fit a USB plug through and still have the indicator LEDs visible.
The only other notable thing I added to the full schematic is that there are reed relays separating the DAC outputs from the plotter inputs. Since the little circuit will be hidden away in the back of the plotter, it’d be pretty easy to forget about it and connect something to the front terminals. Since the plotter itself supports pretty high input voltage ranges, that could mean actually setting the adaptor on fire (not just producing wrong charts). Hence, the relays are open by default and only connect the circuit to the plotter when there’s USB power.
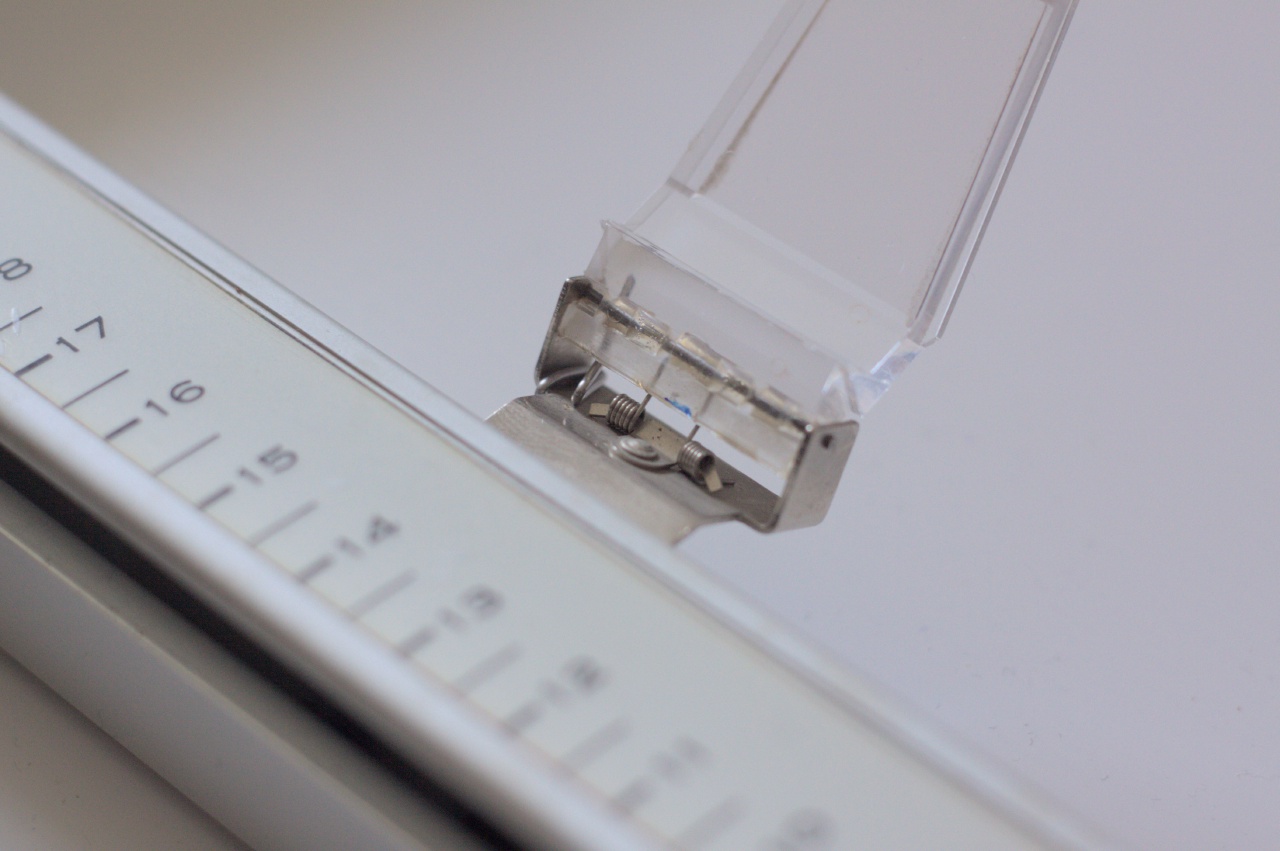
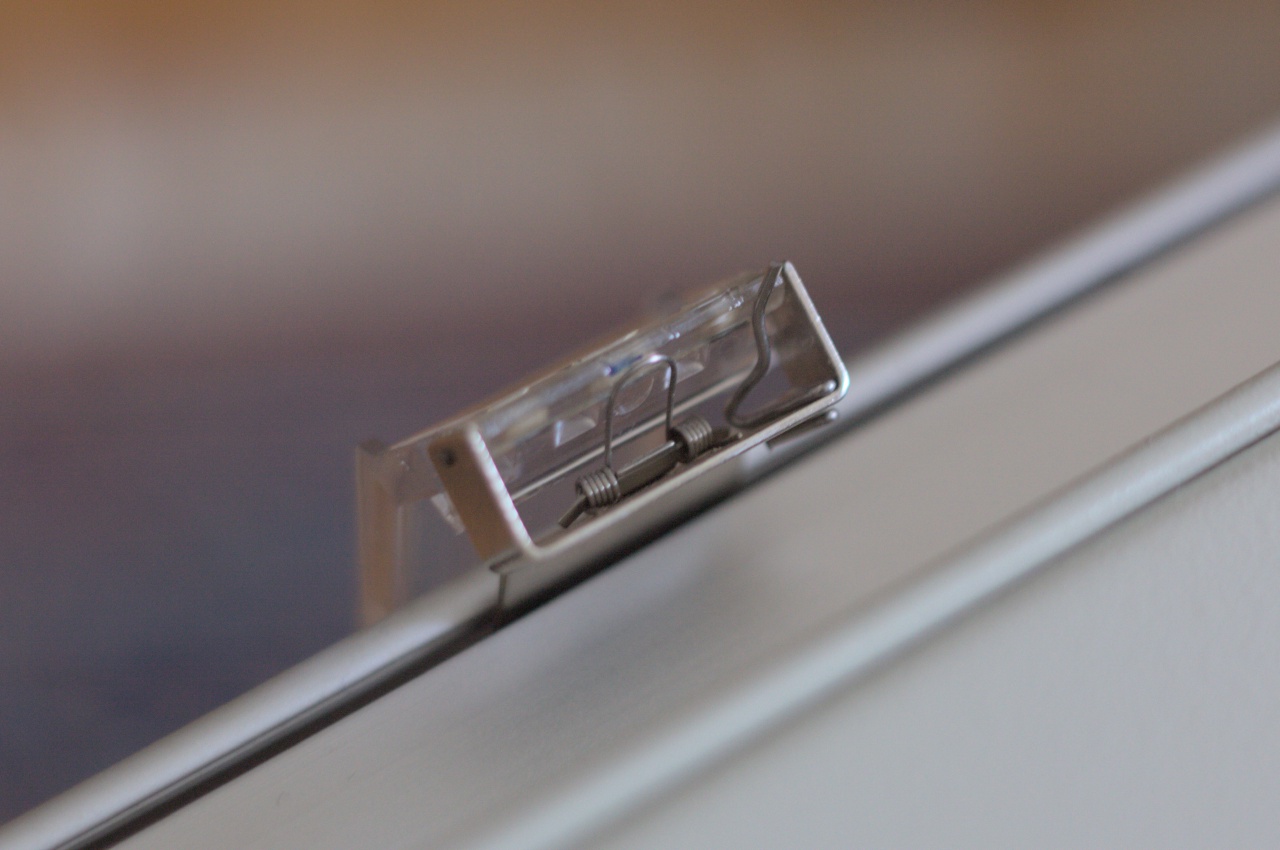
Pens
One issue with using a vintage plotter is that they’re all using some bespoke felt-tip pens which aren’t made any more. All the old stock ones have more or less completely dried up. Some of them can be opened and refilled with a new ink-soaked foam from a felt-tip marker, but not this kind.4
The video embedded above shows the result one such attempt. It’s quite messy to do. On top of that, you can tell the viscosity of the new ink isn’t ideal: there is an ink blotch in every spot the tip is slammed down.
I found out that the gel pins sold by MUJI work well enough. These are cheap, available as refills in a whole range of colours and tip sizes, and don’t start leaking or drying up. I made a little 3D-print to allow using the refills directly.

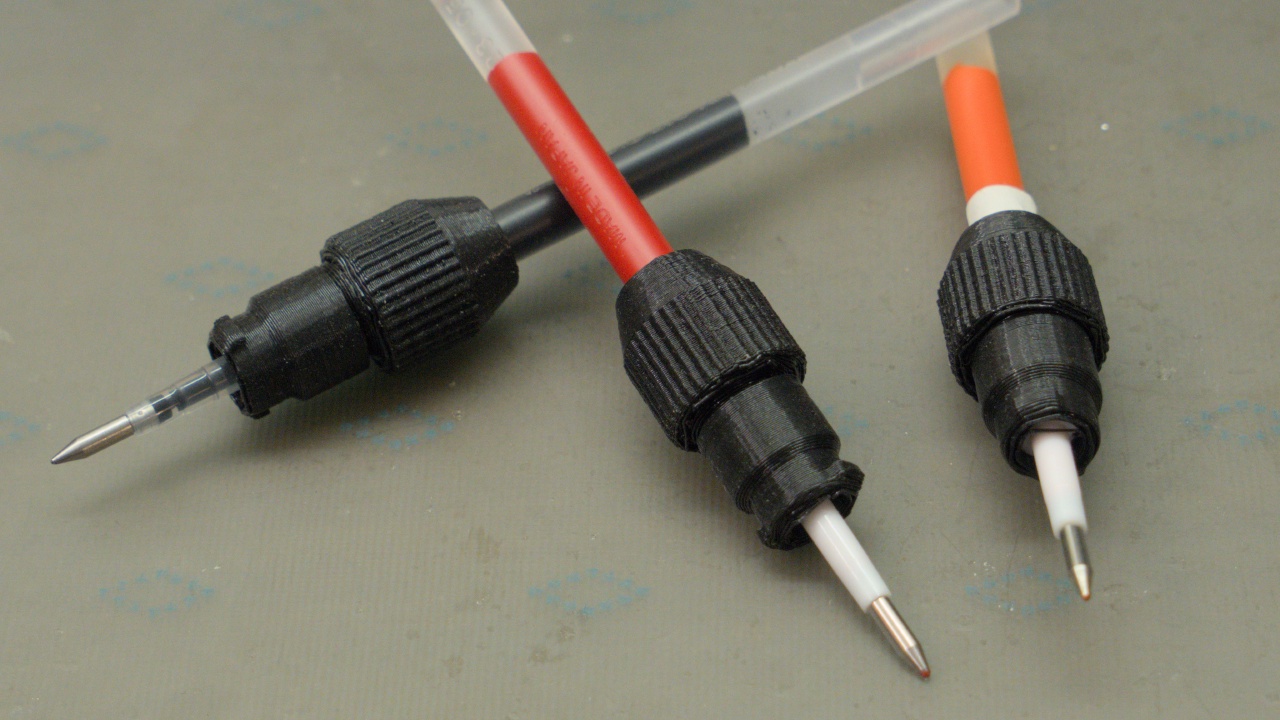
The only remaining problem is that these pens need a bit more downward force than the original pens, which are made for a very light touch. For a while, I just taped a heavy screw to the pen holder, which worked just fine. In the end, I bent a small piece of spring steel to be inserted into the hinge, providing just enough additional pressure at the tip.
What’s left to do
Unlike other projects I’m posting here about, the plotter adaptor firmware is something I’m still working on every now and then. Typically, I’ll make some adjustments when I need some gift cards. Progress is slow, but I’m inching towards, for example, variable speed support.
In the end, this will always be a pretty niche project. Hence, while I could add special commands to for example set the PWM parameters for lifting and setting down the pen, I’ll keep these compile-time constants until I see the use case.
As you might have seen in the video above, the lines the plotter produces are not exactly straight. Likely, cleaning the bearings and setting the wire tensions correctly inside would fix that. Since CuriousMarc scanned and uploaded the service manual that would certainly be doable, but for now, I’m leaving it in its current state—I quite enjoy the subtle imperfections that make it more than just a slow printer.
The final 80 %
The above only covers half of the story, the path from HPGL to paper. That’s the part with all the engineering problems. With solutions, mechanics and electronics and software. The much more open problem is to the other side of the virtual serial port.
I wrote the HPGL parser specifically to cover the commands Inkscape emits. That means any vector art I already have or want to draw is a few clicks away from being automatically traced on paper. But, where I really wanted to go to with this plotter is to explore generative art—something, ideally, omitting the intermediate step of being designed for or on a screen. And more than just stylising photographs by converting shading to halftones or stipples. This is the part where I don’t have a good approach so far.
I think it was cohost user atomicthumbs who said that existing pen plotter tooling was made for ’programmer-type beings’. That has stuck with me. I feel this limitation, even as someone who would fit into that category of people. Because if I have a picture in my mind, it’s not that hard to turn it into a set of coordinates. To write a script processing some data, simulating some system, and the likes. But that process isn’t very suitable for open-ended exploration—it always starts with a concrete idea what the output should look like.
Even if this approach makes it unlikely to create something entirely new and interesting by accident, it is the best I have as a first starting point (for me, as a programmer-type being). I built a set of tools around Jupyter notebooks which allow me to quickly iterate on ideas, previewing the output directly before committing to plot the exported HPGL.
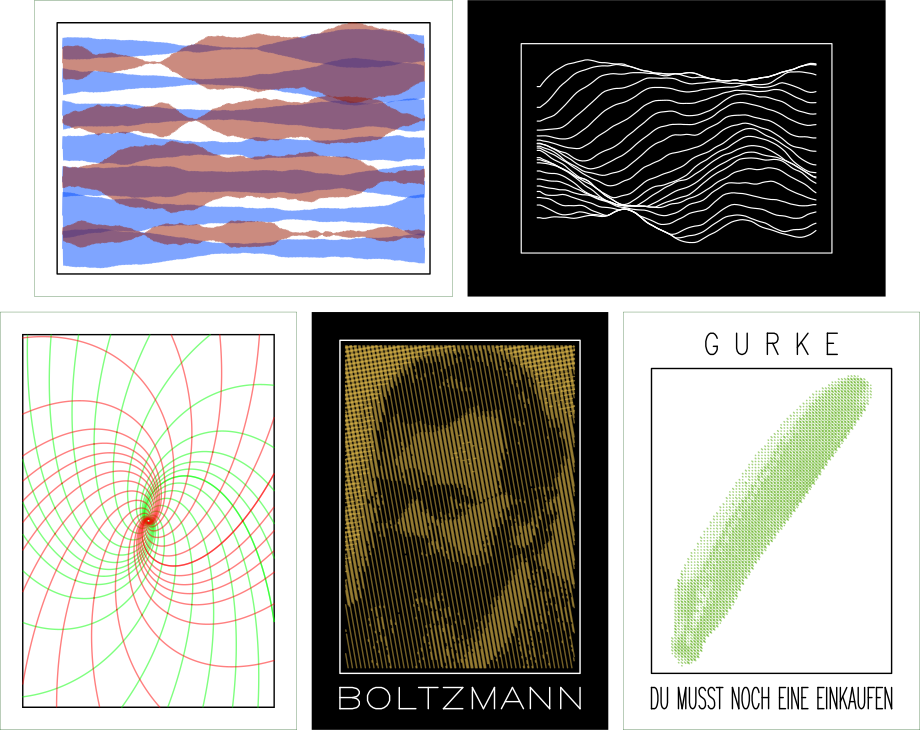
Perhaps I’ll grow this library of tools to deal with data, shapes, and drawings up to more and more abstract levels. Maybe that is the way to go.
From time to time, I still think about what an approach would look like which does not start with the constraint that the plotter is a piece of equipment which needs to be fed a bunch of numbers. What sort of abstraction could be used, retaining the full breadth of possibilities? I don’t have an answer here, yet.
One approach I want to experiment with is some sort of node-based flow. After all, what works well for modular synthesizes (even with video signals) or shaders could be interesting when the graph connecting various transformations operates on point coordinates or shapes instead of signals or image data. A direct candidate would be Blender’s geometry nodes, which people have used for G-Code export to pen plotters and generative 2D line art animations. Even though the latter seems to be very technical in implementation, I want to try for myself whether the mere medium change alone gives me different enough perspective, or if it fosters a different sort of composition than I’m used to.
Links and resources
Hardware and firmware of the adaptor, as well as the OpenSCAD designs of the pen holder are in the project’s repository. My experiments generating plot data using Jupyter notebooks and the necessary Python glue code are available here.
-
Actually, now that I’m revisiting this thought process while writing this blog post, some kind of modular plot synthesizer sounds like a lot of fun! ↩︎
-
Well, almost. Since plotting can take a while, a shell’s file I/O probably times out, so using a serial terminal program:
$ picocom -q /dev/ttyACM1 < 25120.hpgllets the plot actually finish. ↩︎
-
The ‘revision B’ PCB layout in the project’s repository has this fixed. Note that I didn’t get this revision manufactured—I only have one plotter after all. ↩︎
-
Which, by the way, are incompatible with the pens of the HPGL-interface plotters from HP. ↩︎